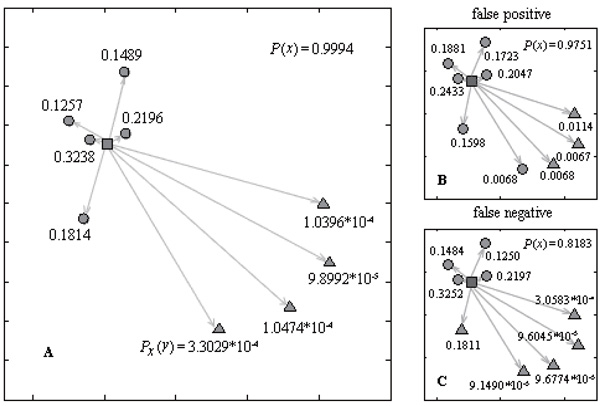
Fig. (1) Illustration of P(x) calculation. This figure is a schematic representation. The x-y coordinates represent the dimensions of a waveform from the spike and noise cluster. The gray circles represent spike events in the spike cluster, whereas the gray triangles represent points in the noise cluster. The gray square represents a given point in the spike cluster. (A) Schematic representation of correctly categorized events. For a given spike Sx in the spike cluster (gray squares), the numbers next to each of the other spikes, Sy , are Px(y) . The arrows denote the Euclidean distance. P(x) for the given point (gray squares), is the sum of all x-y values for all other spike events (gray circles). Note that for events far from sx ,x-y is infinitesimal, and hence they have only a small influence on the P(x). (B) Schematic representation of false positive errors. The P(x) values would be decreased when noise events are detected as the spikes, e.g. the gray circle in the down middle corner close to the noise events. (C) Schematic representation of false negative errors. The P(x) values would also be significantly decreased when spike events are detected as the noises, e.g. the gray triangles in the left middle corner close by the spike events.