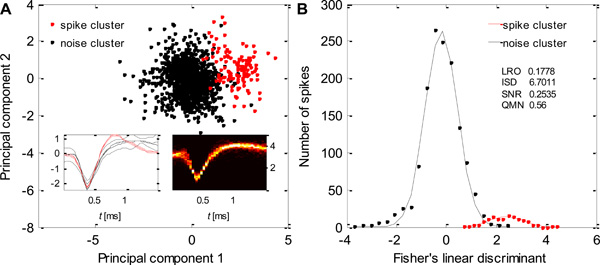
Fig. (5) Real data with intermediate separation. (A) Scatter plot of spike waveforms from all clusters using the first two principal components. (B) Histograms of the projection of each cluster onto Fisher’s linear discriminant between the spike cluster and the noise cluster.