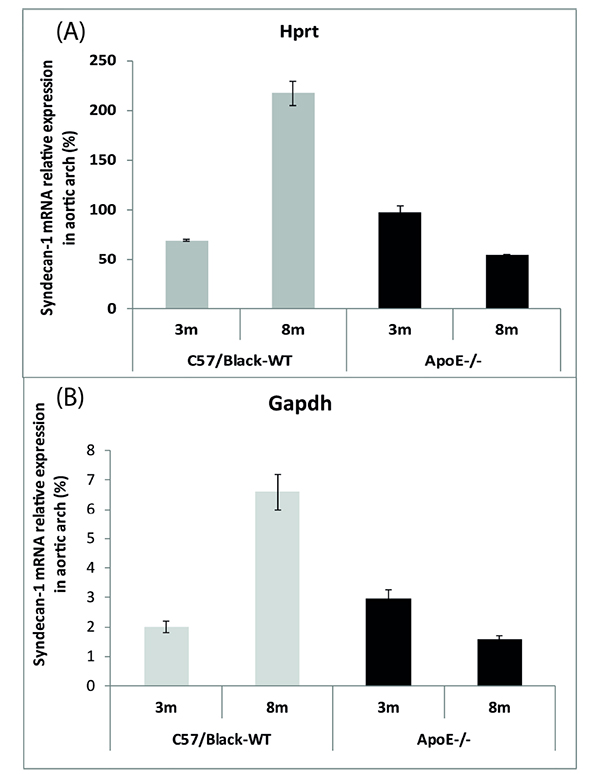
Fig. (1)
Quantitative syndecan1 mRNA analysis in aortic arch of ApoE
-/-
mice and C57 Black mice. A: htrp represents relative gene expression of Sdc1 (
n
= 6,
p
< 0.05). B: The graph represents relative gene expression of Sdc1 (
n
= 6,
p
< 0.05).