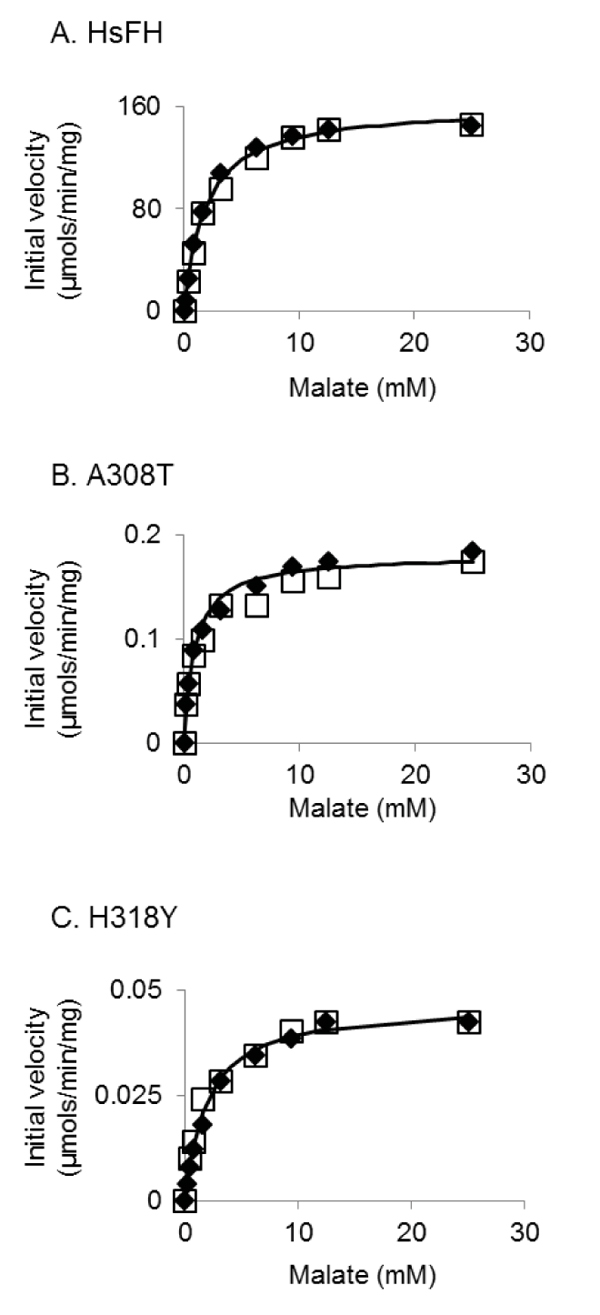
Fig. (5)
Representative kinetic plots of fumarase activity measured for: (A) HsFH, (B) A308T, and (C) H318Y. Initial velocities are plotted versus malate concentration and fitted using the Michaelis-Menten equation (solid lines). Each figure contains the data from two individual experiments (denoted as either open boxes or filled diamonds).