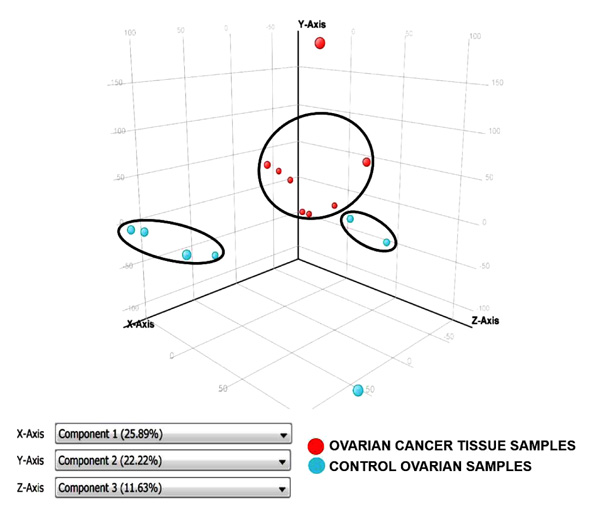
Fig. (2)
PCA of 8 EOC and 7 control ovary tissue samples. Unsupervised PCA was applied to the samples based on variance in gene expressions. The relative positions of individual EOC (shown in red color) and control (sky blue color) samples.