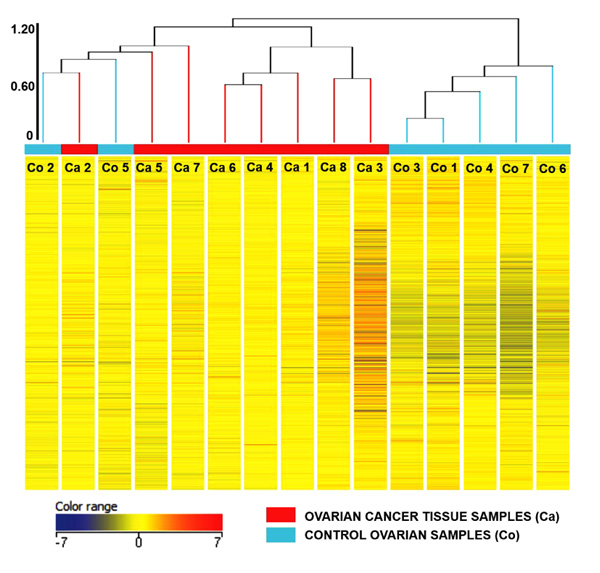
Fig. (3)
Two-way representation of unsupervised hierarchical cluster analysis (HCA) of the expression levels (in logarithmic scale) of all the target probes/genes (X-axis) in each sample (each row), EOC labeled as cancer in red and control labeled as control in sea green color from all subjects (n = 15) and their clustering based on expressional distance (Pearson correlation coefficient) between samples in dendrogram formation (Y-axis). Each horizontal line represents a single probe, and each column represents a single sample. Relative expression of each probe is color-coded: high (red) and low (blue), as indicated in the color legend.