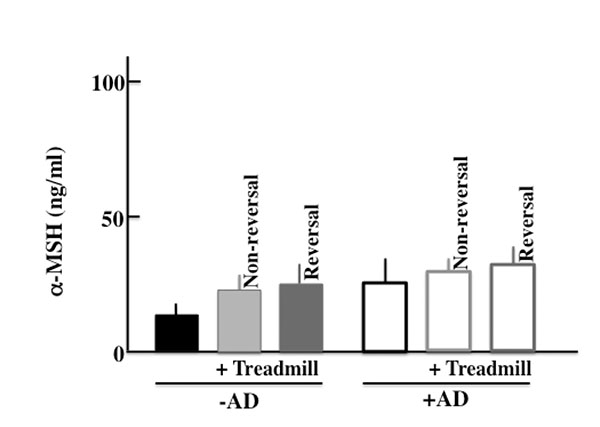
Fig. (Sp1)
An analysis of the plasma a-MSH concentration after the two-week treadmill treatment. –AD: SPF NC/Nga mice, +AD: conventional NC/Nga mouse. The values are presented as the mean ± standard deviation, derived from 6 animals.*, P<0.05.