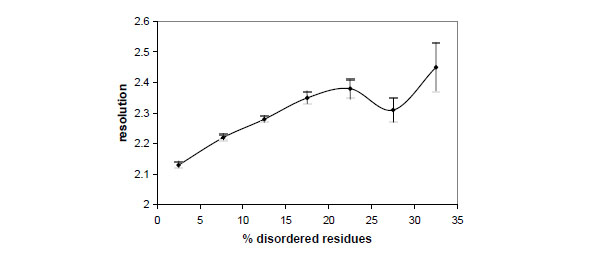
Fig. (2)
Dependence between the crystallographic resolution and the percentage of disordered residues observed in the crystal structures deposited in the Protein Data Bank. Vertical bars indicate the standard deviation of the mean.