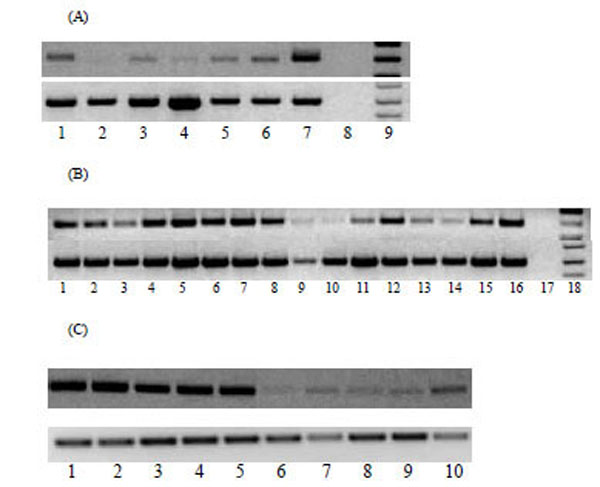
Fig. (1) (A) Expression of MTA1 in normal human tissues analysed by RT-PCR. Cycling conditions were optimized so that the RT-PCR products were analyzed when amplification is within the linear phase. Lanes 1-9 from left to right, normal brain, kidney, heart, liver, lung, PBMC, testis, negative control and DNA ladder. (B) Tissue distribution of MTA1 transcript in malignant tissues and cell lines was analysed by RT-PCR. Lanes 1-4: prostate cancer tissues; lanes 5-7: prostate cancer cell lines (lane 5: DU-145; lane 6: LNCaP; lane 7: PC3); lanes 8-11: renal cancer; lanes 12-16: gastric cancer. Amplification of GAPDH was also performed in parallel as a control in all samples. (C) Agarose gel electrophoresis of mGAPDH and mMTA1 following RT- PCR from murine tumour cell lines and tissues. Lanes 1-10 from left to right, CT26, A20, RENCA, CMT, B16, liver, lung, muscle, spleen, kidney.