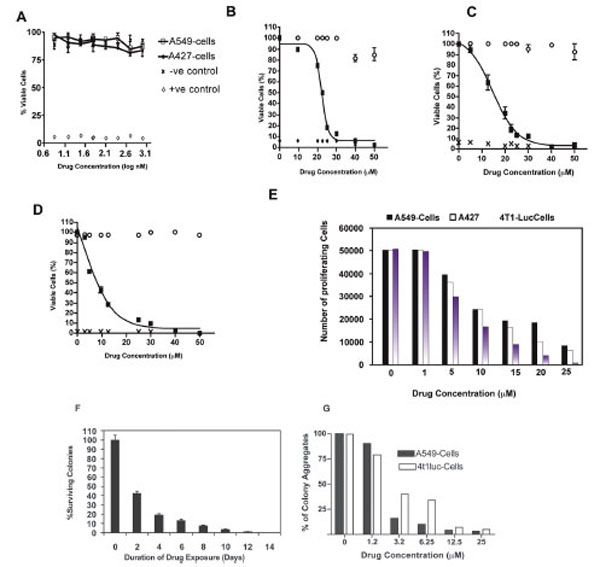
Fig. (1). Breast and lung cancer tumor cell lines exhibit differential susceptibility to micromolar doses of paclitaxel at equal drug exposure time Cell viability was determined by a modified MTT assay. After 24-h drug exposure with indicated concentrations, cells were incubated with 20 µl of MTS reagent for 2-h. Absorbance values were measured at 490 nm. Experiments were done in triplicate for each cell type, with appropriate controls. The half maximal effective concentration (EC50) of paclitaxel for each cell type was determined by nonlinear regression analysis using GraphPad Prism Software® (version 4.0 for windows, San Diego, CA). Data represent normalized mean values. (A) Nanomolar concentrations of paclitaxel have little effect on tumor cell viability especially at lower concentrations. However a dose response is observed in both tumor cell types, with A427 cells showing slightly increased sensitivity than A549-cells at higher nanomolar drug concentrations (500 nm and 1000 nm).Open circles represent negative control, crosses and diamonds represent positive control, black rectangles represent samples. (B) EC50 for A549 cells was determined to be 22.5 µM. (C) EC50 for A427 was determined to be 12.5 µM and (D) EC50 for 4T1-Luc was determined to be 8.5 µM. At high drug doses > 40 µM, no significant difference in tumor cell line response to paclitaxel is observed.However, clear differences in cell type sensitivity to drug dosage is observed at concentrations < 20 µM. Of the 3 tumor cell lines,A549 and A427 show low sensitivity to the drug at low concentrations, with 4T1-Luc cells appearing to be the most sensitive in this dose range. (E) Anti-proliferative effect of paclitaxel is enhanced in 4T1-Luc cells, but not in A427 and A549 cells at high drug doses. Proliferation of tumor cells after 24-hour drug treatment was analyzed by MTS assay (Molecular Probes), as described in methods section. Experiments were done twice in triplicates. N=6. At concentrations ≥ 10 µM, a drastic reduction in the number of proliferating cells was observed in 4T1-luc, in comparison with A549 and A427 cells which showed significant cell proliferation. (F) 4T1-luc tumor cells show increased aggregated and clustered colony formation. Clonogenic survival assay was performed to evaluate the behavioral response of tumor cells to an extended duration of drug exposure. A time course study was performed to determine colony formation at a fixed drug concentration (12.5 μM) over varying exposure times (2- 14 days). Each data point was derived from the results of at least three independent experiments. N= 9. Data show mean ± SEM of three experiments, each in triplicate. Relative to untreated controls, a time dependent-decline in the number of colonies formed was observed in 4T1-luc cells, but not in A549 or A427 cells (not shown). In these latter cell lines, cells were more dispersed and very few aggregated colonies (cell clusters consisting of more than 100-cells) were observed. (G) 4T1-luc cells form colony aggregates in a dosedependent fashion, relative to A549-cells which show reduced cell colonies at higher drug concentrations. Overall, however, more proliferating A549 cells than proliferating 4T1-luc cells were present at higher concentrations.