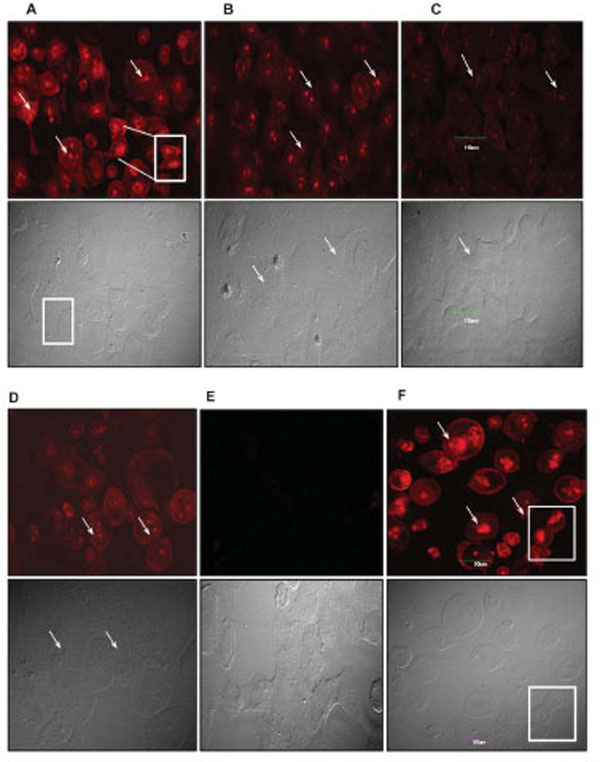
Fig. (3). A549 tumor cells exhibit both apoptotic and mitotic morphology in response to paclitaxel treatment Arrows point to fragmented nuclei. Inserts and boxed regions highlight fragmented nuclear DNA and mitotic cells. These distinct populations of mitotic cells were not observed in 4T1-luc tumors. Scale bar indicates 90 µm. Cell death was determined by Live-Dead Viability Assay as described. Exclusion of EthD-1 dye by intact membrane of live cells distinguishes dead cells from live ones. Images are shown in red and grey channels. (A – F) -Cell death in A549 cells. Fragmented nuclei are visible in cells treated with high paclitaxel doses, 50 µM (A) and 25 µM (B), as well as in cells treated with moderate doses, 12.5 µM (C) and 6.25 µM (D). (E) No dead populations are observed in untreated cells; mitotic cells are visible in the grey channel. In contrast to the morphology of 4t1-luc tumor cells, mitotic proliferating A549 cells may contribute to A549 tumor resistance at low doses of paclitaxel. (F) Apoptotic induction in positive control (ethanol-treated) cells.