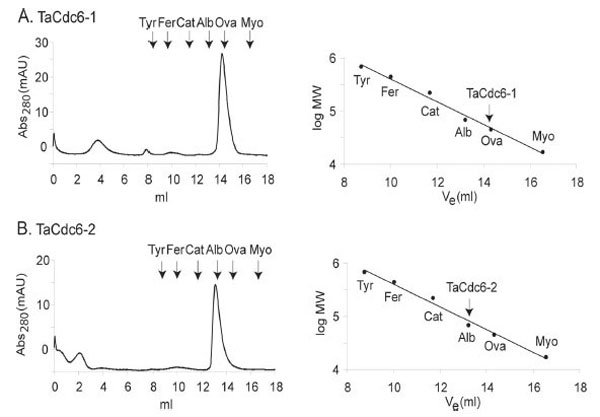
Fig. (2). T. acidophilum Cdc6 proteins are monomers in solution A. Gel filtration chromatography of TaCdc6-1 was performed as described in “Materials and Methods”. The peak elution volumes of thyroglobulin (Tyr, 670 kDa, 8.76 ml), ferritin (440 kDa, 10.02 ml), catalase (Cat, 232 kDa, 11.7 ml), albumin (Alb, 67 kDa, 13.22 ml), ovalbumin (Ova, 45 kDa, 14.34 ml) and myoglobulin (Myo, 13 kDa, 16.56) are shown in the elution profile of TaCdc6-1 (upper panel) and used to make a calibration curve (lower panel). The arrow indicates the position of the TaCdc6-1 proteinB. Gel filtration chromatography of TaCdc6-2. The position of molecular marker proteins is shown as described in A. The arrow indicates the position of the TaCdc6-2 protein.