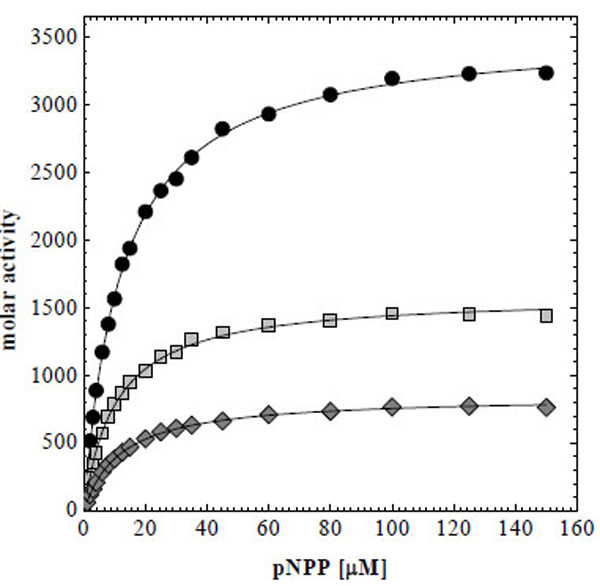
Fig. (2) Michaelis-Menten plot of soluble PhoA (solid black circles), PhoA-pIII-phagemid (light grey squares) and PhoA-pVIII-phagemid (dark grey diamonds). Molar activities are plotted against the substrate concentration to calculate the kinetic parameters summarized in Table 1