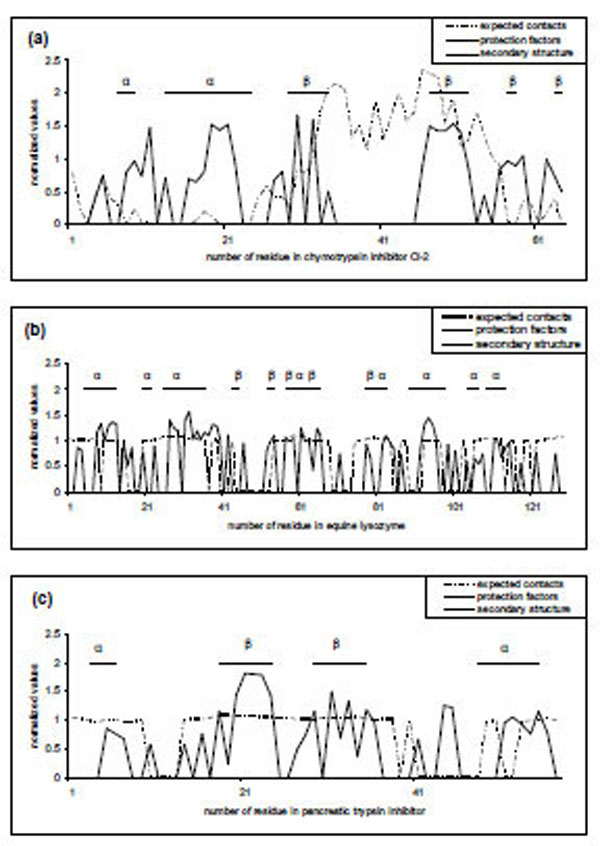
Fig. (1) Comparison of predicted and experimental protection factors for three proteins (a) 2ci2, (b) 2eql, (c) 6pti. Dotted curves are predictions made by our FoldUnfold method with window size of 11 residues. Values that are lower than 20.4 are considered as unprotected and correspond to zero, other values normalized on the average difference between the expected number of contacts and the threshold value of 20.4. Solid curves are original protection factors presented as 0 for unprotected residues and more than 0 for protected residues (normalized on the average protection factor for protected residues). Straight lines represent regular secondary structure according to the DSSP program [26].