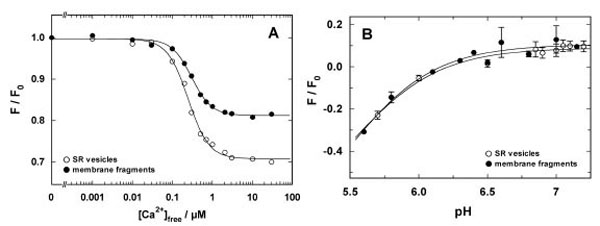
Fig. (3) Comparison of Ca2+ and H+ binding to the SR Ca-ATPase in SR vesicles (open circles) and open membrane arations (solid circles). (A) The experiment was performed at pH 7.2. The fluorescence intensities were normalized to the level in the nominal absence of Ca2+. The normalized fluorescence amplitude was plotted against the calculated free Ca2+ concentration in the buffer solution. The data points were fitted with a Hill function (Eq. 1). The half saturating Ca2+ concentration was 0.25 µM (vesicles) and 0.3 µM (membrane fragments). The Hill coefficients were 1.7 in both cases, and the maximum fluorescence changes was 0.3 for the vesicle preparation and 0.19 for the open membrane fragments. (B) pH titration in the absence of Ca2+ was started in buffer adjusted to pH 7.3-7.4 and performed by addition of small aliquots of HCl. pH was measured after each addition with a pH microelectrode. The lines hrough the data sets are Hill fits that show the close proximity of the H+ binding properties of the SR Ca-ATPase in both preparations