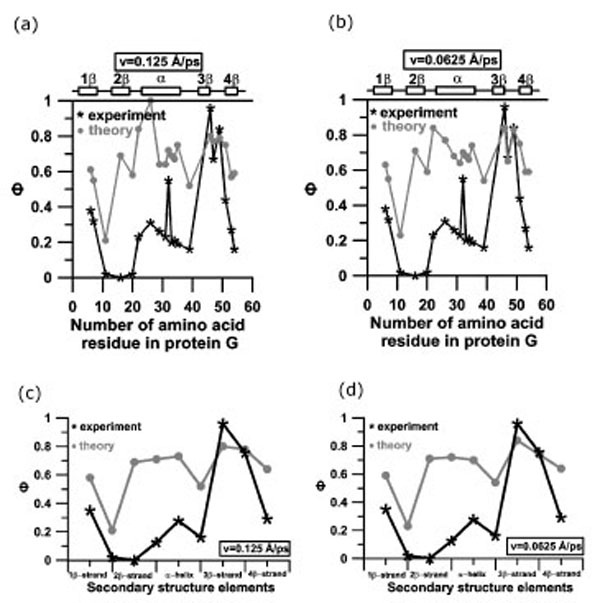
Fig. (8) Profiles of experimental and theoretical Ф-values for protein G (a, b) and profiles of experimental and theoretical Ф-values for protein G, averaged over amino acid residues, included into elements of secondary structure (c, d): (a, c) v=0.125 Å⋅ps-1; (b, d) v=0.0625 Å⋅ps-1. Structures in transition states for calculation of Ф-values were taken from the region of the first force peak.