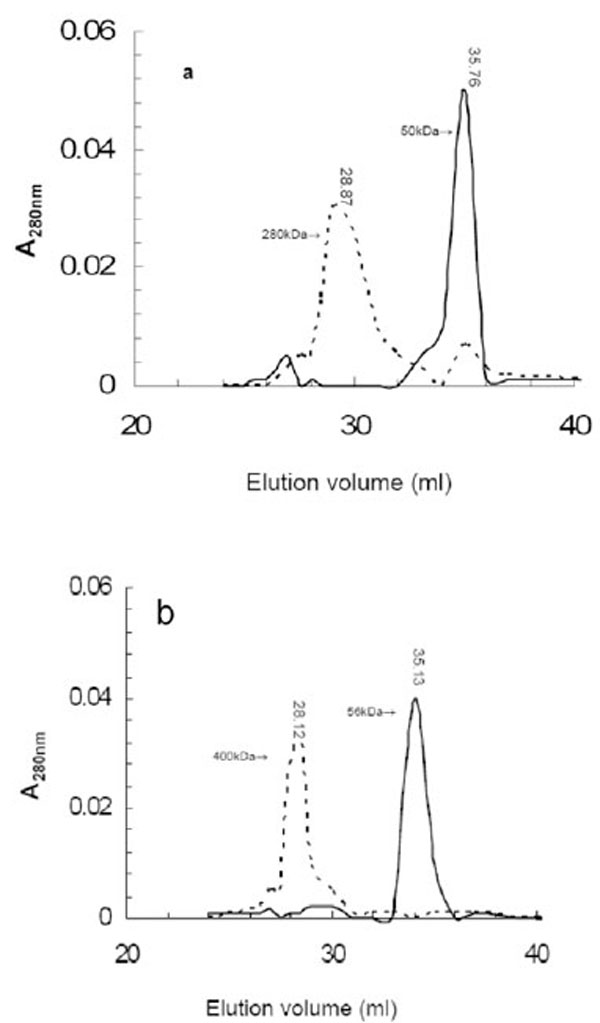
Fig. (4) The elution profiles of aggregated LipA (a) and LipB (b) after gel filtration chromatography. The first peaks (dotted line) represent aggregated enzymes eluted in the absence of SDS, the second sharper peak (solid line) represent monomeric enzyme treated and eluted with 1% SDS. The elution volume and corresponding molecular mass as calculated from standard marker is indicated on top of each peak. Elution volumes of molecular weight markers used for calculating the apparent molecular weight of the lipases were: Ferritin (440 kDa); 27.9 ml; bovine serum albumin (66 kDa), 35.56 ml; albumin (45 kDa), 36.8 ml; carbonic anhydrase (29kDa), 39.94 ml; and cytochrome (12.8 kDa), 41.67 ml.