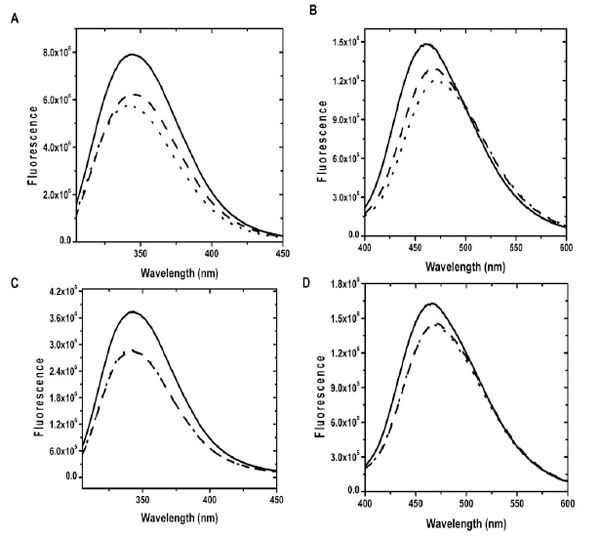
Fig. (1). Steady-state Fluorescence Spectra of CaBD and E99Q/E143Q The emission spectra of proteins were recorded at 20 °C in the presence of 500 µM EDTA (dotted line), 2 mM Mg2+ and 1 mM EGTA (dash line) and 100 µM Ca2+ (solid line). (A) and (B) show Trp and AEDANS fluorescence of CaBD, where (C) and (D) show Trp and AEDANS fluorescence of E99Q/E143Q.