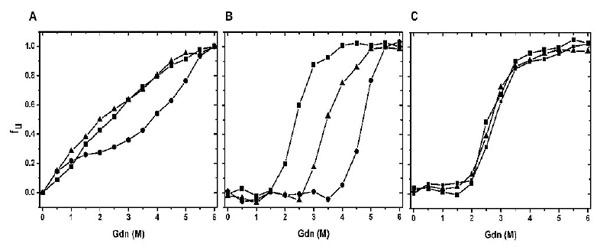
Fig. (6) Chemical Stabilities of CaBD and E99Q/E143Q. Proteins were incubated at different concentrations of Gdn, and their maximum wavelengths were recorded. The percentage of unfolding was calculated as described in the experimental section. (A) shows the chemical unfolding of CaBD in the presence of 500 µM EDTA (square), 10 mM Mg2+ (triangle), and 1 mM Ca2+ (circle). (B) and (C) show the chemical unfolding of AEDANS-CaBD and AEDANS-E99Q/E143Q in the same condition. The curves are the average of three independent experiments each.