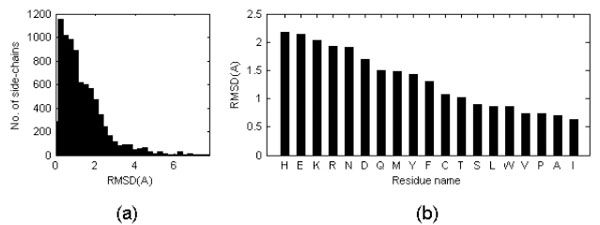
Fig. (2) (a) Distribution of side chain RMSD after optimal superposition of all Cα atoms (only for the cases in which the RMSD of the Cα atoms is lower than 1 Å). When the PDB entry corresponding to a NMR structure contains several models, values were averaged. The values reported in the figure are thus averages of averages. (b) Mean side chain RMSD shown on per residue type basis. RMSD is calculated on a basis of all side chain atoms excluding hydrogen atoms.