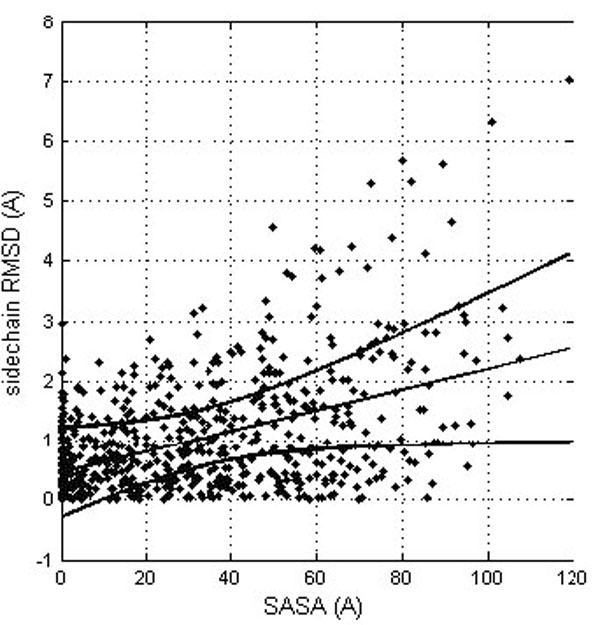
Fig. (3) Correlation between the residue solvent accessibility and the RMDS for the corresponding side chains (after their optimal superposition). The linear trend line is shown (straight line) together with the confidence interval at the 0.99 probability level (curved lines).