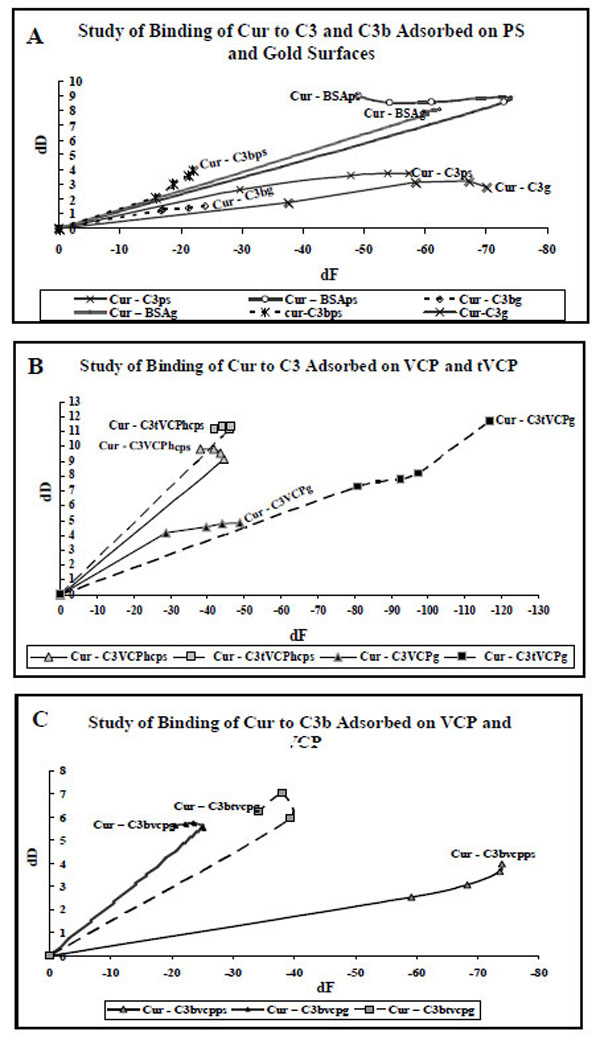
Fig. (10) A. dF values (X-axis) at five different data points for the adsorption of Cur on C3, C3b and BSA adsorbed on gold and PS are plotted against dD values (Y-axis). The data labels are used to show AMs. The suffix g or PS in the subscript of an AM indicates that the AM is adsorbed onto either gold or PS surface).B. dF values (X-axis) at five different data points for the adsorption of Cur on C3 adsorbed on VCP and tVCP bound to the gold and PS surfaces are plotted against dD values (Y-axis). The data labels are used to show AMs. The suffix g or PS in the subscript of an AM indicates that the AM is adsorbed either on gold or PS surface).C. dF values (X-axis) at five different data points for the adsorption of Cur C3b adsorbed on VCP and tVCP bound to the gold and PS are plotted against dD values (Y-axis). The data labels are used to show AMs. The suffix g or PS in the subscript of an AM indicates that the AM is adsorbed onto either gold or PS surface).