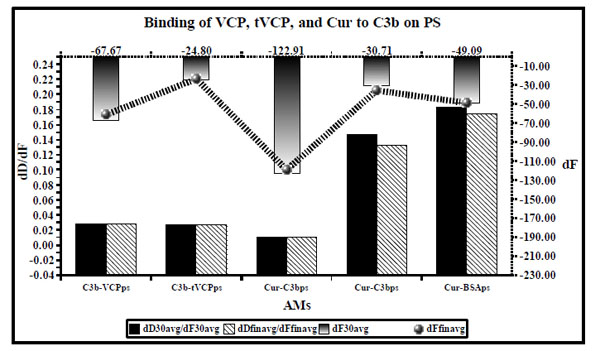
Fig. (6) dD/dF ratios (the primary X and Y axis) and dF values (the secondary Y axis [right] and and secondary X axis [Top] shown by ultrafine dotted lines) for binding of VCP, tVCP, Cur and C3b on PS are as shown in this figure. dD/dF ratios at 30 min interval are shown by solid black bars whereas final dD/dF ratios are shown by hatched bars. The dF30 values are shown by gradient black bars whereas the final dF values are shown by a black hatched line bearing gradient black dots ( ). The dD/dF ratios and dF values indicate average of the values obtained from the two experiments unless specified in the Table 1.