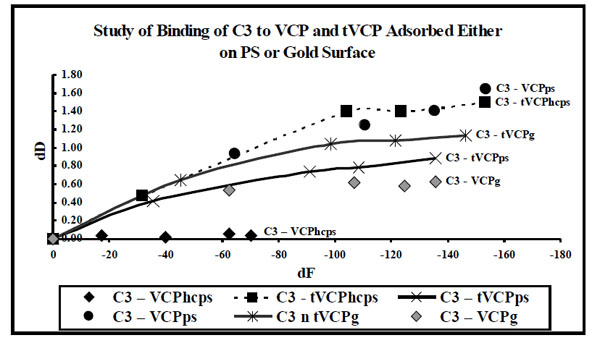
Fig. (8) dF values for the interaction of VCP and tVCP adsorbed either on the gold or ps surfaces with C3 ( X-axis) were plotted against dD values (Y-axis). The data label for each series indicates AMs (Series: C3-VCPhcps, C3-tVCPhcps, C3-tVCPps, and C3-VCPg indicate adsroption of C3 on VCPhcps, tVCPhcps,tVCPps, and VCPg, respectively. “hc” prior to ps in the case of VCP denote VCP at high concentration).