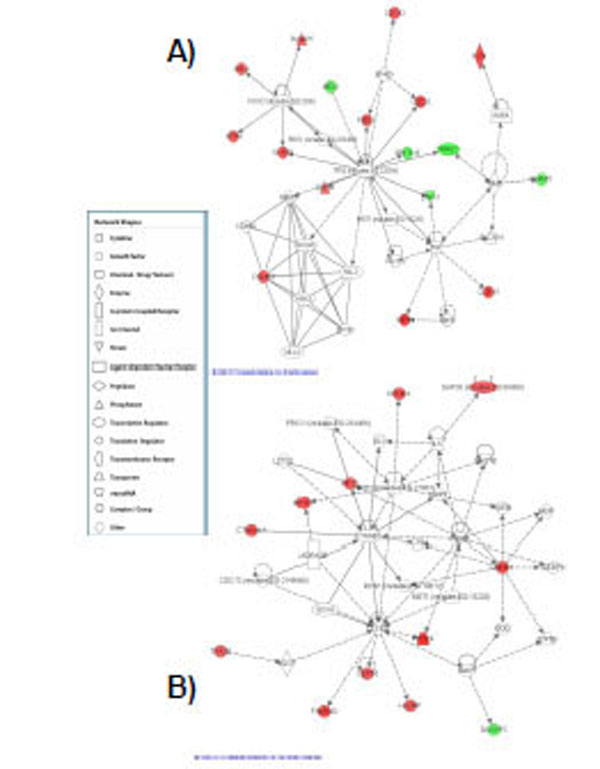
Fig. (3) A) Highest scoring network assembled from the genes responsive at the highest dose of radiation tested. This network was centered on ERK1 signalling. Red represents upregulated genes and green represents downregulated genes. B) Network assembled from the genes responsive at the high dose and clustered around TP-53 signalling. Red represents upregulated genes and green represents downregulated genes.