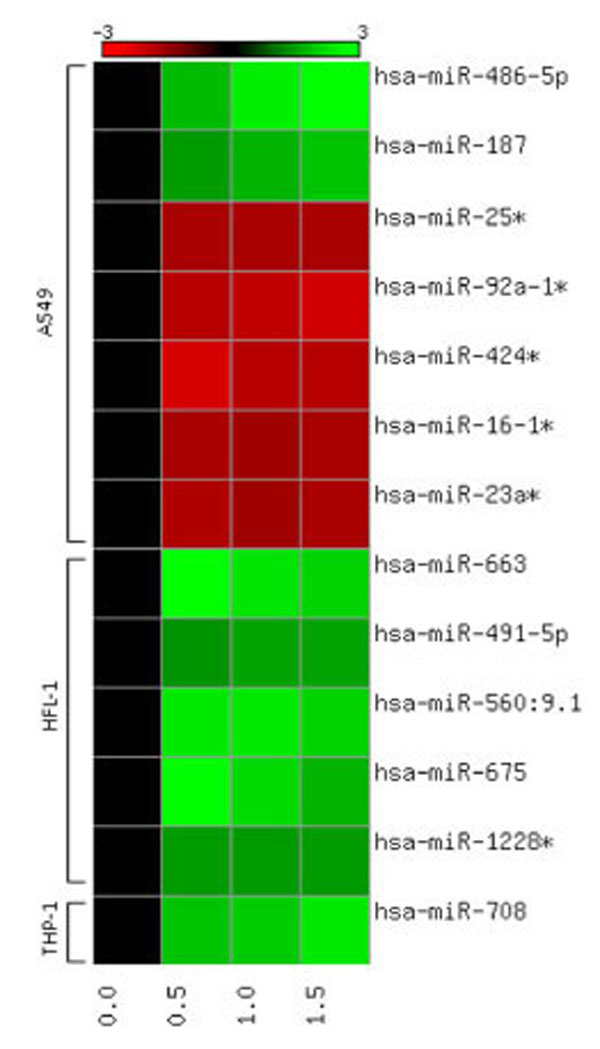
Fig. (1) Heat map showing quantitative expression patterns of miRNAs responsive at all doses (0.0, 0.5, 1.0, 1.5 Gy) for all cell lines (A549, HFL-1 THP-1). Red signifies down-regulation and green signifies up-regulation in miRNA expression, based on an n=5 biological replicates.