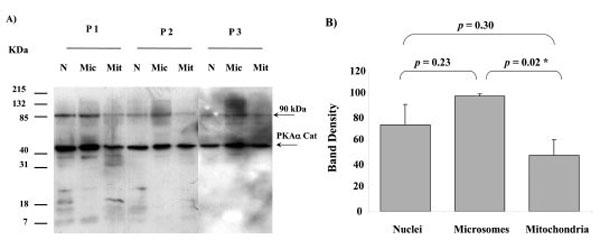
Fig. (2) PKAα Cat expression in nuclei (N), microsomes (Mic) and mitochondria (Mit) from 3 different human placentae, (P1, P2 and P3). For each placenta one sample from each fraction was analysed. SDS PAGE, Western blotting and autoradiography results shown in A). A major protein band with approximate size of 44 kDa was detected in all fractions by the PKAα Cat antibody. A minor band at approximately 90 kDa was also present. The relative intensity taken as percentage of the most intense band for each placenta (values represent the mean ± S.E.) of the 44 kDa bands shown in A) are plotted in B). An asterisk indicates a significant difference with a p value of less than 0.05.