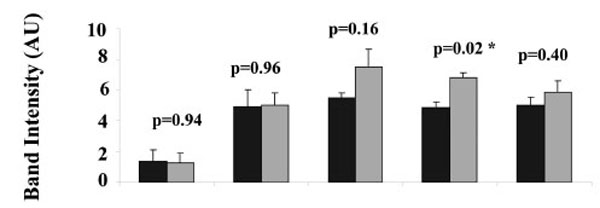
Fig. (3) Comparison of PKAα Cat expression in heavy (H) and light (L) mitochondria. For each of 5 placentae one preparation of heavy and one preparation of light mitochondria was produced. For each preparation of light or heavy mitochondria, three aliquots were taken for SDS PAGE and Western blot, the intensities of the three 44 kDa protein bands in each preparation of heavy and light mitochondria from five different human placentae are shown. Values represent the mean ± S.E. of triplicate samples ■ - heavy mitochondria; ■- light mitochondria. An asterisk indicates a significant difference with a p value of less than 0.05.