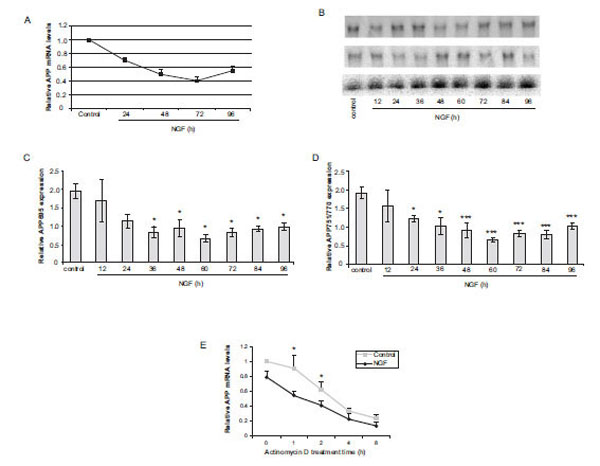
Fig. (1) Analysis of steady-state APP mRNA expression. (A) Real-time PCR analysis of total APP mRNA relative to beta-2 microglobulin levels following treatment with 50 ng/mL NGF. (B) Representative northern blots of APP695 (upper panel), APP751/770 (middle panel) and 7s (lower panel) expression in control (untreated) and NGF (50 ng/mL) treated PC12 cells. (C) Densitometric analysis of steady-state APP695 mRNA expression normalized to 7s. Treatment with NGF from 36 to 96 h resulted in a statistically significant (*p < 0.05) decrease in APP695 mRNA expression. (D) Densitometric analysis of steady-state APP751/770 mRNA expression normalized to 7s. Treatment with NGF from 24 to 96 h resulted in a statistically significant (*p<0.05; ***p<0.001) decrease in APP751/770 mRNA expression. (E) Real-time PCR analysis of total APP mRNA relative to beta-2 microglobulin levels in control and 24 h NGF exposed cells treated with actinomycin D for 1, 2, 4 or 8 h. Significantly lower levels of relative APP mRNA were observed following treatment with NGF in the absence of actinomycin D and when treated with actinomycin D for 1 or 2 h (*p<0.05). Data are presented as the mean ± SEM and represent 4 (E), 5 (A) or 6 (B, C and D) independent experiments. Statistical significance was determined by performing a one-way ANOVA followed by the Dunnett test to determine any significant differences between control and each time point.