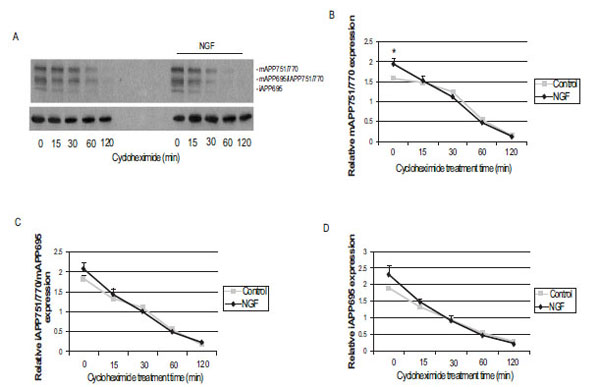
Fig. (2) APP protein levels in control and NGF-treated PC12 cells in the presence or absence of cycloheximide. (A) Representative immunoblots obtained from lysates of control (untreated) and NGF (50 ng/mL) treated PC12 cells treated with 10 µg/mL cycoheximide from 30 min to 2 h. Samples were separated by SDS-PAGE and transferred to nitrocellulose membranes. The top panel represents total APP expression and the bottom panel shows the corresponding α-tubulin levels in each sample. The top APP band represents mature (m) APP751/770, the middle APP band corresponds to immature (i) APP751/770 and mAPP695 and the lowest molecular weight APP band corresponds to iAPP695. Densitometric analysis of mature APP751/770 (B) immature APP751/770 and mature APP695 (C) and immature APP695 (D) protein levels normalized to α-tubulin. Treatment with NGF for 72 h resulted in a statistically significant (* p < 0.05) increase in mature APP751/770 and immature APP695 levels. Data are presented as the mean ± SEM and represent 6 independent experiments. Statistical significance was determined by performing a one-way ANOVA followed by Tukey-Kramer’s multiple comparisons test to determine any significant differences between control and NGF treated samples at each time point.