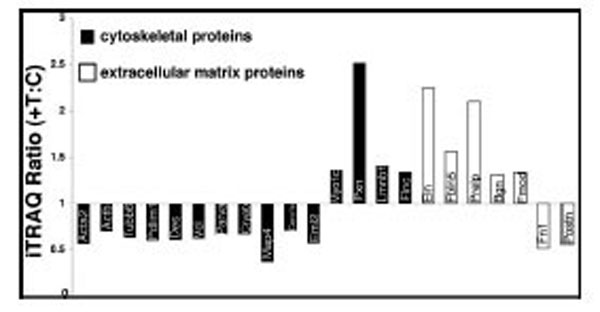
Fig. (7) Effect of tianma on the expression levels of cytoskeletal
and ECM proteins. Protein expression levels were quantitatively
analyzed ex-vivo by using iTRAQ after tianma treatment for three
months as described in the experimental procedures. The Y-axis
shows the iTRAQ ratios of proteins between tianma-treated and
untreated controls. Values above 1.2 indicate up-regulation and
below 0.83 indicate down-regulation of the proteins. Proteins
shown (from left to right): black bars: down-regulated: Acta2, Actb,
Tubb6, Pdlim1, Des, Vcl, Parva, Cryab, Map4, Coro1c, Eml2, up-regulated:
Myo1c, Pxn, Lmnb1, Flnc. White bars: up-regulated:
Eln, Fbln5, Prelp, Bgn, Fmod; down-regulated: Fn1, Postn.