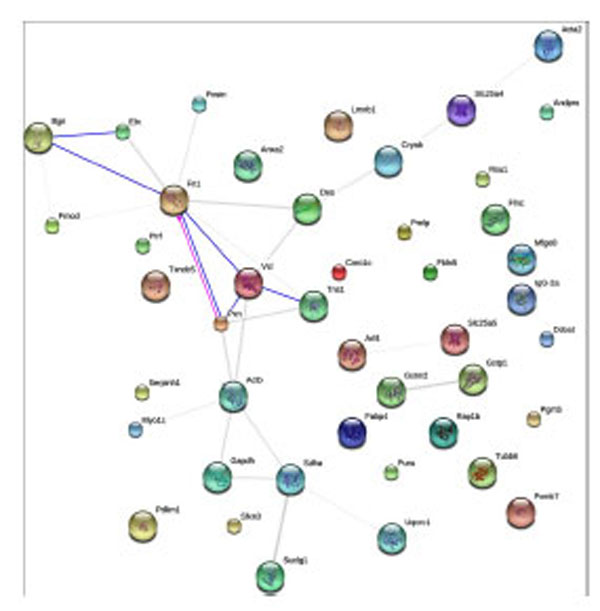
Fig. (9) STRING-9.0 analysis (rattus norvegicus at http://string-db.org/; default mode) of tianma-modulated proteins in rat aorta.
Different line colors represent the types of evidence for the association.
Network display: Nodes are either colored (if they are directly
linked to the input as in supplemental table 1) or white (nodes of a
higher iteration). Edges, i.e. predicted functional links, consist of
multiple lines: one color for each type of evidence.