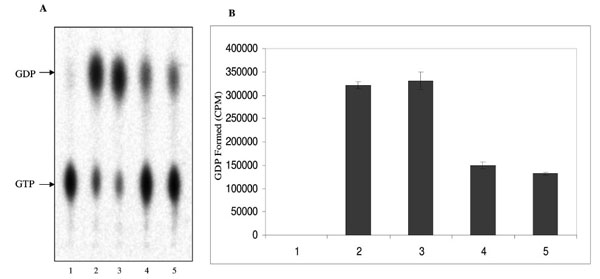
Fig. (4) GTPase activity of MsmNDK and MsmNDK-H117Q. A. Lane 1. GTP alone, Lane 2. MsmNDK at 15 min, Lane 3. MsmNDK at 30
min, Lane 4. MsmNDK-H117Q at 15 min, Lane 5. MsmNDK-H117Q at 30 min. B. Bar graph showing the GTPase activity in terms of α32PGDP
formed by MsmNDK or MsmNDK-H117Q mutant at 15 or 30 min. Assay was repeated independently three times for each sample. Counts per minute (CPM) were recorded and standard deviations were calculated.