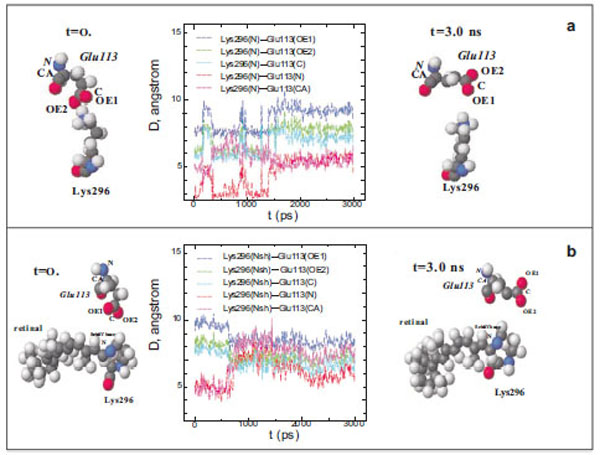
Fig. (1) Diagram of interatomic distances (D) between different atoms of Glu113 and the ε-amino group N atom in Lys296, and the molecu-lar dynamics of Glu113 and Lys296 in free opsin (rhodopsin without the chromophore group) in the initial (t=0) and final (t=3ns) moments of modeling. The C, O, N, and H atoms are shown as grey, red, blue, and white spheres (a). Interatomic distances (D) between different at-oms of Glu113 and the protonated Schiff base N atom (NSh), and the molecular dynamics of Glu113 and Lys296 in rhodopsin at the initial (t=0) and final (t=3ns) moments of modeling (b).