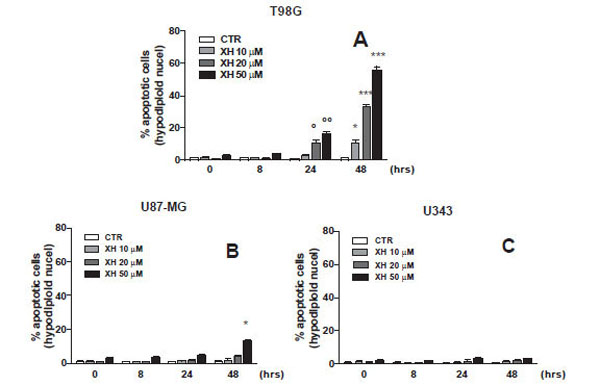
Fig. (1) Dose/effect curve at different administration time of three different cell lines of glioblastoma (A) T98G, (B) U87-MG and (C) U343-MG. Apoptosis was induced by xanthohumol at different concentrations (10-20-50µM) after administration at different times (8-24-48 hours) and measured by flow cytometry, as a percentage of hypodiploid nuclei by permeabilization and incorporation of iodide of propridio (PI). Data are shown as mean ± SEM of three experiments performed in triplicate. (A) ° P <0.05, ° ° P <0.01 vs CTR T98G cells 24 h, * P <0.05, ** P <0.01, *** P <0.001 vs CTR T98G cells 48h. (B) * P <0.05 vs. CTR cells U87-MG 48 h.