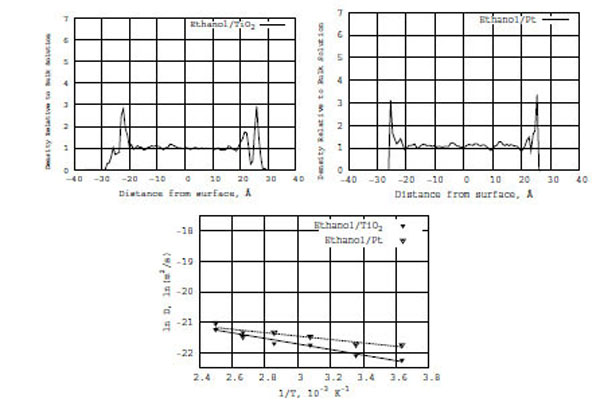
Fig. (6)
Top: Z-density distributions of pure ethanol on the TiO
2
(left) and Pt (right) surfaces. Bottom: Relation between ln
D
(
T
) and reciprocal temperature in Kelvin; ethanol in the presence of TiO
2
(solid line) and Pt (dashed line) surfaces.