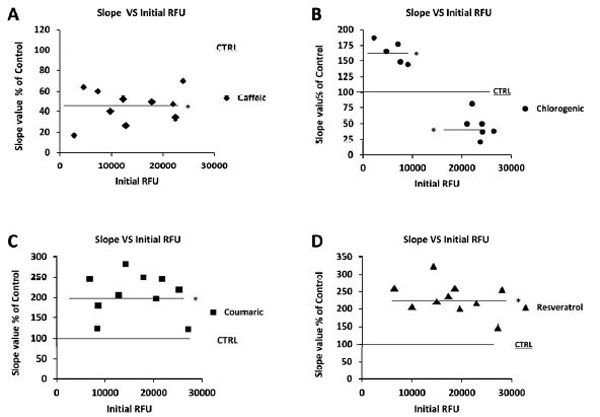
Fig. (3) Effect of the intracellular redox state on antioxidant-elicited anti- and pro-oxidant behaviour. Figure panels shows plots of the slope
value expressed as % vs the initial measured intracellular ROS level for (A) caffeic acid, (B) chlorogenic acid, (C) coumaric acid, (D) resveratrol.
In panels A-D, the value of 100 in the y-axis refer to the slope value for a ROS kinetic measurements of untreated cultured human
ECs (CTRL). Other data in the y-axis refer to the slope value obtained from five different ROS kinetic measurements of cultured human ECs
treated for 120 minutes in the presence of 25 µM of (A) caffeic acid, (B) chlorogenic acid, (C) coumaric acid, (D) resveratrol. Initial RFU
value in the x-axis for each panel refer to intracellular ROS measurements performed at the beginning of each experiments. In panels A-D,
value in the y-axis that lie above 100 are considered as an antioxidant-induced pro-oxidant outcome, while value that lie below 100 are considered
as an antioxidant-induced anti-oxidant outcome. Data in the y-axis are expressed as percentage of CTRL (untreated cells value=100).
* significantly different from CTRL at P<0.05.