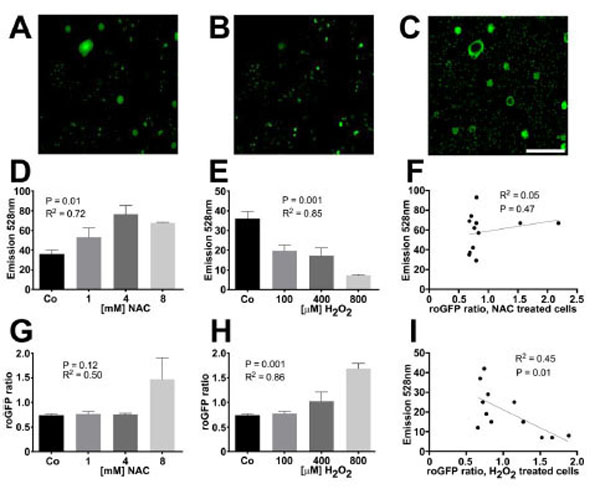
Fig. (3) Intensity of reductide signal mirrors redox-sensitive green fluorescent protein (roGFP).H9c2 cells stably expressing roGFP were seeded into a 96-well plate overnight. The following day, cells
were treated with multiple concentrations of NAC, H2O2, or vehicle for 60 minutes. Live cell imaging was
performed using high-throughput fluorescence microscopy. After image acquisition, cells were washed and
reductide was added to each well at a concentration of 1 µM. Cells were incubated for 30 minutes followed
by plate reader fluorescence detection (excitation/emission = 485 nm/528 nm). Fluorescence microscopy
images following excitation at 405 nm and 488 nm were analyzed using Image J to determine the average
ratio of emission intensities for each well. These ratios were compared well by well with the FAM signal
from reductide incubation to determine the correlation between reductide and roGFP assessment of redox
state. Representative fluorescence microscopy images of H9c2 cells expressing roGFP following excitation
at 405 nm and 488 nm are shown (A and B). A ratiometric image following background subtraction is also
shown (C). FAM emission signal following incubation of cells with reductide correlated with the
concentration of redox modifying agent (NAC or H2O2) used to pretreat cells (D and E). RoGFP ratios
correlated with the concentration of H2O2 used to pretreat cells but not with NAC (G and H). FAM
emission intensity following incubation with reductide was significantly correlated with roGFP ratio
following pretreatment with H2O2 but not NAC (F and I).