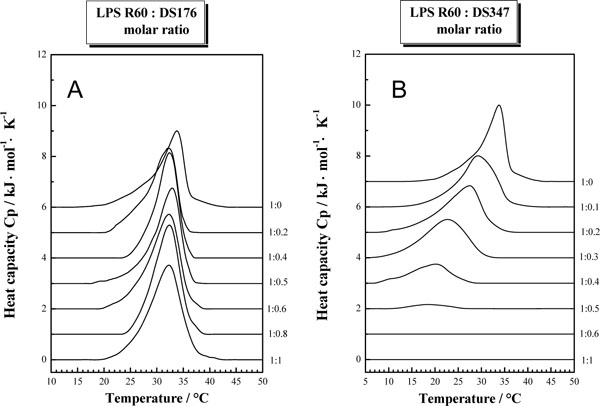
Fig. (3) Gel-to-liquid crystalline phase transition of the hydrocarbon chains of LPS R60 at different concentrations of DS176 (A) and DS347
(B) by differential scanning calorimetry. The heat capacity Cp is plotted versus temperature showing the enthalpy change at the phase transition
temperature.