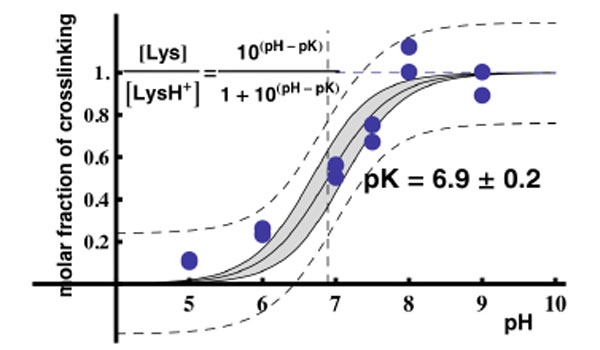
Fig. (9) Plot of the molar fraction of crosslinking as a function of pH. Two data sets from two separate experiments of Fig. (5B) were used to obtain this graph. The data were fitted with Mathematica to the function inscribed in the figure with the following features : the dashed
lines defines the 95% confidence intervals for the prediction of a single value, whereas the continous lines and the gray-shaded region define the 95% confidence intervals for the prediction of the average curve with pK = 6.9 ± 0.2.