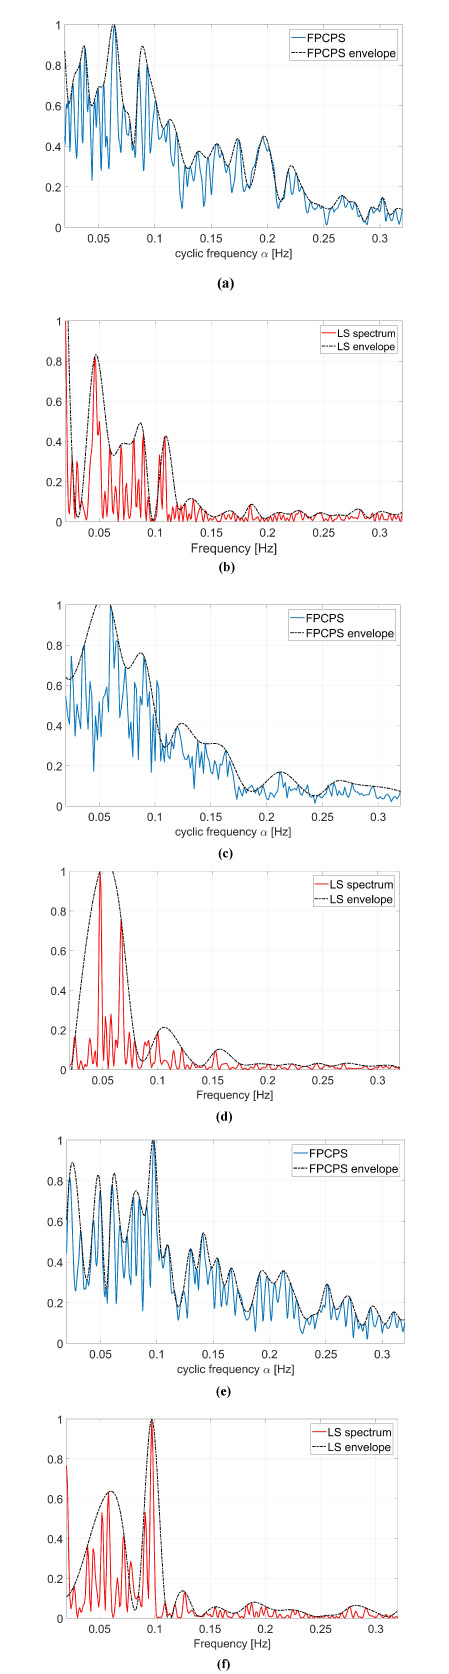
Fig. (6)
Comparison between FPCPS and LS spectrum for three different clinical datasets (downloaded from the physionet database [47]). Patients ID: 16272 (a-b), 16483 (c-d), and 16539 (e-f). The dotted-dash line refers to the envelope of the signals which can help the understanding of the figure.