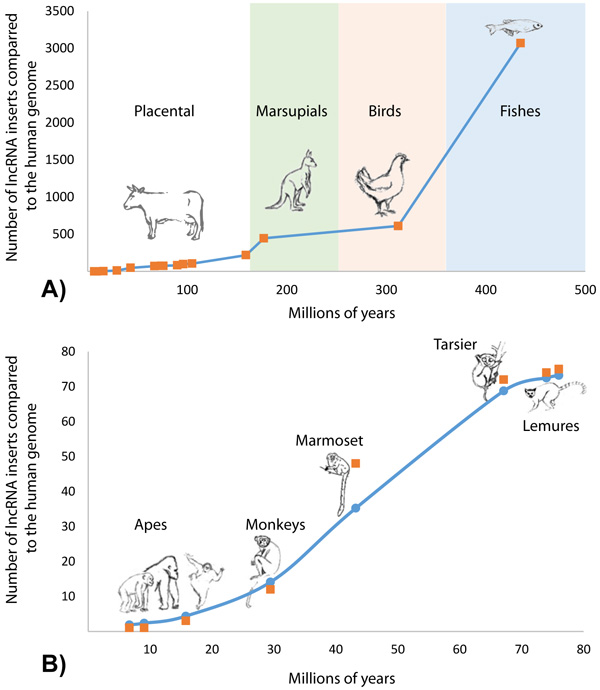
Fig. (3)
Number of mismatched lncRNAs with regards to other species in predicted GIs plotted along speciation time. A) Average numbers of human genome specific lncRNA calculated for animals with similar divergence time (Table 3). B) Boxes represent numbers of human genome specific lncRNA as revealed by comparison to genomes of different primates. Line represents the expected numbers of specific lncRNA estimated by the logistic equation (1).