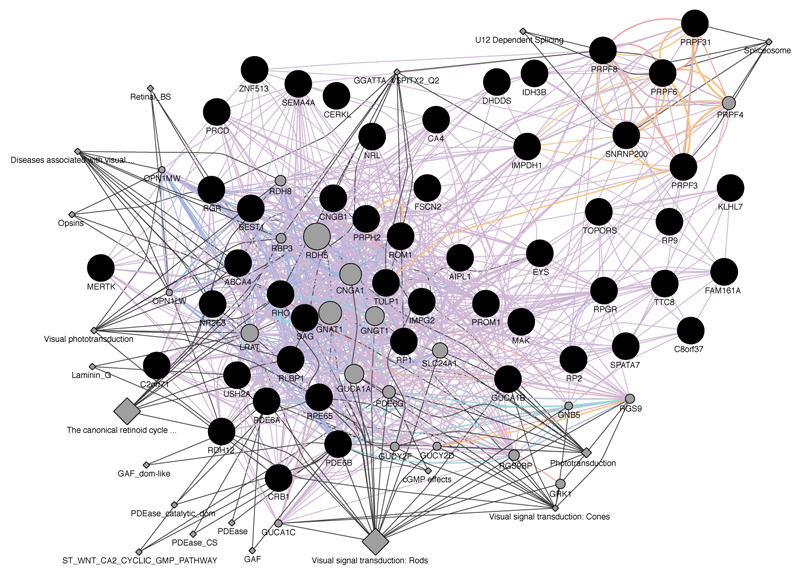
Fig. (1)
Intersection pathways of 50 known causative genes of retinitis pigmentosa. This image shows the Cytoscape pathways analysis, supported by GeneMANIA plug-in, with nodes and edges reflecting relationships between query genes involved in retinitis pigmentosa etiopathogenesis. Edge colors: Co-expression (light purple), physical interaction (antique pink), genetic interaction (green), shared protein domains (golden yellow), pathway (light blue), predicted (orange) and common function (grey).