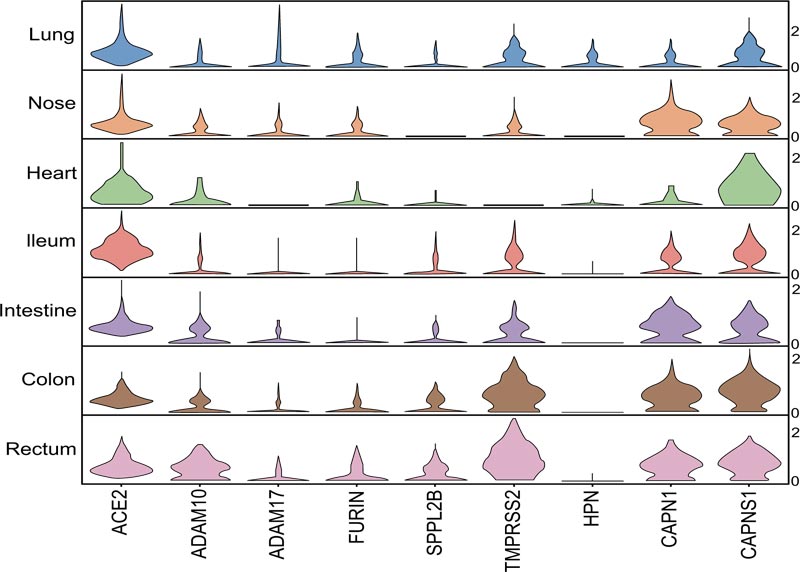
Fig. (3C) The expression of selected endopeptidases in the target organs. Stacked violin plot of gene expression, the width of the graph has shown the frequency of how much cell has same expression level. The top of each graph represents the highest cell gene expression.The expression of selected endopeptidases in the target organs.