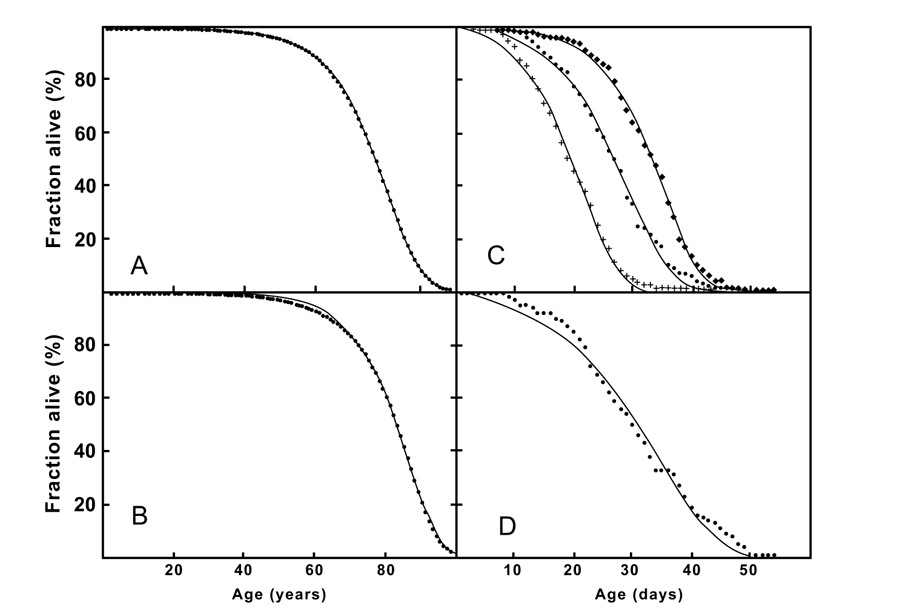
Fig. (2)
Examples of quantitative Gompertz fits of survivorship curves. A: Dutch male population, B: Dutch female population: C: House flies on various diets: Diet 1; left curve; Diet V; middle curve and Diet VI; right curve. D: Honeybees (males) under normal conditions; E: B6-mice fed ad libidum; F: B6-mice calory restricted diet. Black dots are observational data (yearly survival data of the human population; weekly or daily survival in the animal studies); lines are the best fitting curves. All examples show a deceleration of mortality at an advanced age. Quantitative data in Table. 1