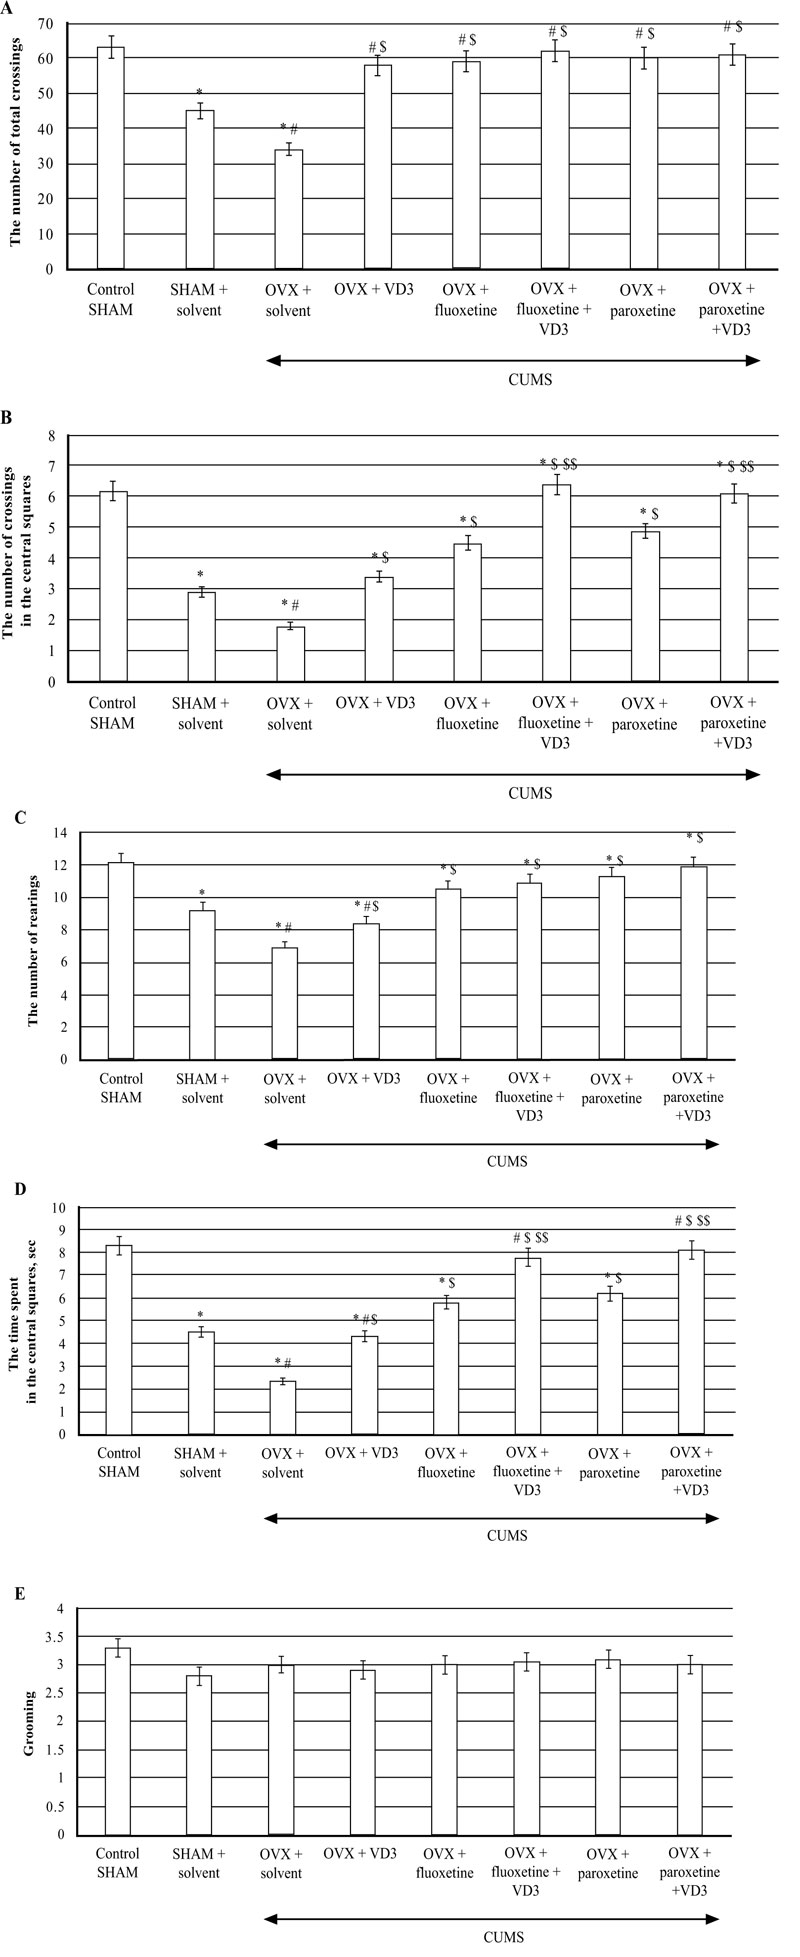
Fig. (5)
The behavior of long-term OVX rats exposed to CUMS after SSRIs alone or in a combination with VD3 treatments. A – the number of total crossings, B – the number of crossings in the central squares, C – the number of rearings, D – the time spent in the central squares, s, E – grooming. * P − < 0.05 versus the control group, # − P < 0.05 versus the SHAM group exposed to CUMS, $ − P < 0.05 versus the OVX group subjected to CUMS, $$ − P < 0.05 versus the OVX group subjected to CUMS treated with fluoxetine or paroxetine, respectively. The data are presented as mean ± SD; n = 7 in each group.