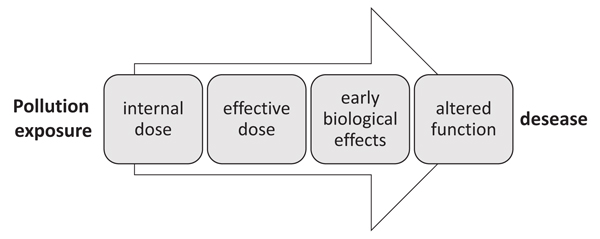
Fig. (2)
Graphical representation of the continuum from exposure to pathology.