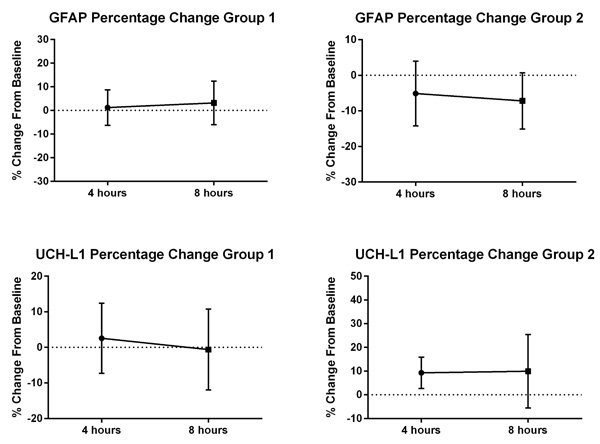
Fig. (1) The concentration of GFAP and UCH-L1 over time. The percentage change (averages with standard deviations) of GFAP and UCH-L1 in Group 1 (Panel 1A and C, respectively) and Group 2 (Panel 1B and D, respectively) from baseline to 4 and 8 hours.