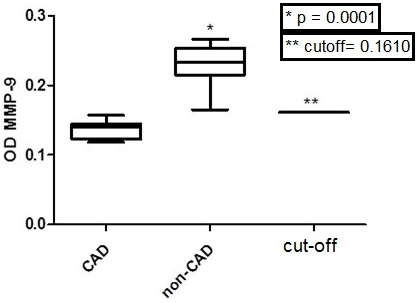
Fig. (4) Comparison of MMP-9 Optical Density’s (OD) between CAD and non-CAD groups by ROC curve cutoff (p < 0.0001; Mann-Whitney comparison test). MMP-9 = metalloproteinases-9; CAD = carotid disease, non-CAD = non-carotid disease, ROC = received operator characteristics curve. CUT = cutoff. ROC cutoff were 0.1610; Data are show as box-plot percentiles. Data were considered significant when p < 0.05 with a C.I. of 95%.