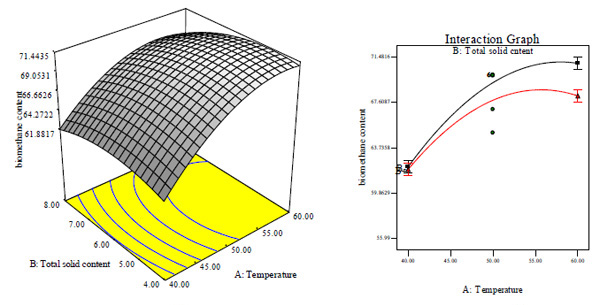
Fig. (3A)
Three dimensional surface plot and Fig. (
3B
) interaction plot that shows the interactive effect between temperature and total solid content on biomethane content.